Introduction/Background
In the world of e-commerce, products are easily available for consumers to order online and deliver to their homes. The importance of reviews has increased as people are buying more products online from platforms, like Amazon or eBay. People are relying on customer reviews or user-generated content to analyze the effectiveness of a product. So, analyzing the data from those customer reviews to make the data more dynamic is an essential field nowadays[1,2,3]. With the advancement of machine learning algorithms, we can filter out spam or junk reviews to ensure that customers have verified reviews.
Literature Review
Spam analysis has been widely studied since 2008 with “Opinion and Spam Analysis” from Jindal and Liu, 2008 [10] being one of the seminal works in the field. They were the first to classify spam into three categories (though in this project we only classify opinions as either spam or not spam):
-
Untruthful Opinions - Opinions made to deliberately mislead readers (think underserving positive reviews, unjust negative reviews).
-
Brand-Only Reviews - Opinions that target the brand rather than the product the brand sells.
-
Non-Reviews - Advertisements, Irrelevant reviews containing opinions, and any review that is not related to providing feedback on the product.
The paper notes that detecting class 2 and class 3 spam is non-trivial whereas detecting class 1 spam is trivial.
Another important work in the field by Ott et. al in 2011 is Finding Deceptive Opinion Spam by Any Stretch of the Imagination[6], which attempts to use work from psychology and computational linguistics to automate the detection of spam reviews on TripAdvisor reviews. Some of their main contributions include creating a “gold standard” opinion spam dataset by scraping TripAdvisor and asking humans to classify TripAdvisor reviews as either spam or not spam. They then compare this manual approach of labeling spam with an automated approach that includes featurizing reviews based on part-of-speech (POS), Linguistic Inquiry and Word Count (LIWC), and text categorization (unigrams, bigrams, trigrams). Surprisingly, one of the main results found was that automated labeling of reviews as spam or not spam performed much better than manual human labeling, which we take into account and use this fact in our data preprocessing step.
Other works such as [8] consider the fact that it is possible to precisely and accurately label each review as either spam or not spam, and use Positive-Unlabeled Learning in order to perform spam classification. PU Learning is when one knows for sure a subset of data is positively labeled, in this case as spam, and the rest is unlabeled, i.e. they can still be either spam or not spam.
In a state-of-the-art review paper [11], they note that Yelp has a proprietary algorithm [7] that excels at spam detection and that methods for annotating spam datasets include rule-based, human-based, algorithm-based filtering, and paid-manual-human-review-based. Moreover, the features considered in these reviews have mostly been related to linguistic features and text features, relating to their review bodies. We attempt to expand on this by also considering Amazon review-specific metadata.
Problem Definition
Problem Definition: The rise of e-commerce platforms like Amazon has led to an exponential increase in the number of product reviews. However, this surge has also given rise to the problem of fraudulent or spammy reviews, which can significantly impact the credibility and reliability of the review system. To address this issue, there is a need for a robust and automated system capable of detecting and filtering out fake reviews, ensuring the integrity of the review platform.
Motivation: In the competitive e-commerce landscape, product reviews play a crucial role in influencing consumer decisions. The trustworthiness of these reviews is paramount for both customers and sellers. The presence of fraudulent or spammy reviews can mislead customers, harm the reputation of genuine products, and undermine the overall reliability of the review system. Developing an automated solution to identify and eliminate such reviews will not only enhance the credibility of the review platform but also contribute to a more transparent and trustworthy online shopping experience for users.
Data Collection
The dataset we will be using is the Amazon US Reviews, more specifically, the data set for Musical Instruments product reviews. [4] As of October 17th, 2023, the data set was removed due to Amazon choosing to defunct their datasets [5]. We were able to download the dataset and we implemented our code with a local copy. We are working with the “Musical Instruments” subset, which has 904,765 data points, and 15 features. The 15 features are: ‘marketplace’, ‘customer_id’, ‘review_id’, ‘product_id’, ‘product_parent’, ‘product_title’, ‘product_category’, ‘star_rating’, ‘helpful_votes’, ‘total_votes’, ‘vine’, ‘verified_purchase’, ‘review_headline’, ‘review_body’ and ‘review_date’.
Data Visualization
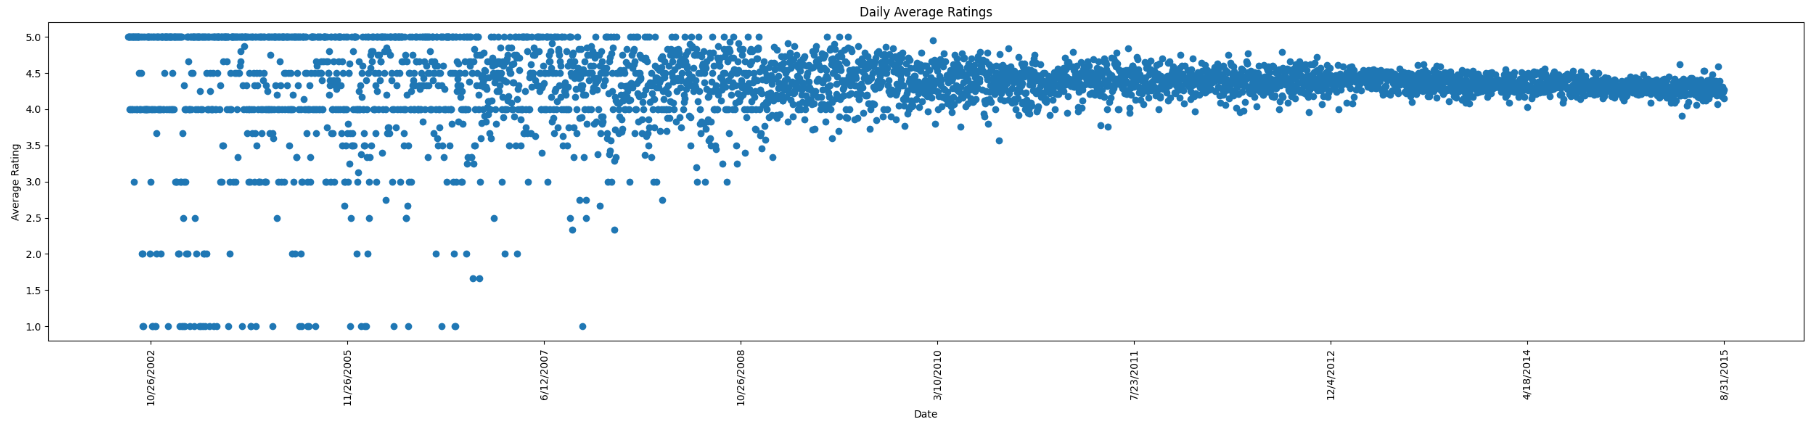
Initial Data:
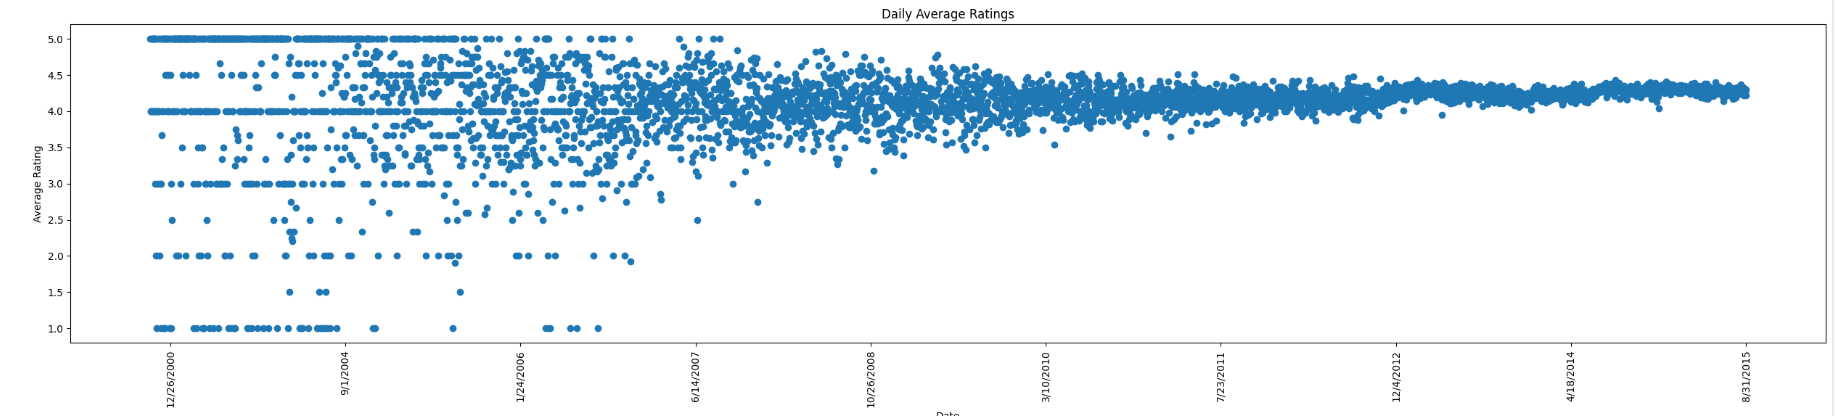 This is a plot of our initial raw data. For days with more than one data entry, we averaged the ratings to ensure each day is only represented from this graph once. As you can see, most of the data hovers around a 4-star rating, and the ratings become more stable as time goes on as a result of having more data points.
Vine and Verified Status with Relative Number of Stars
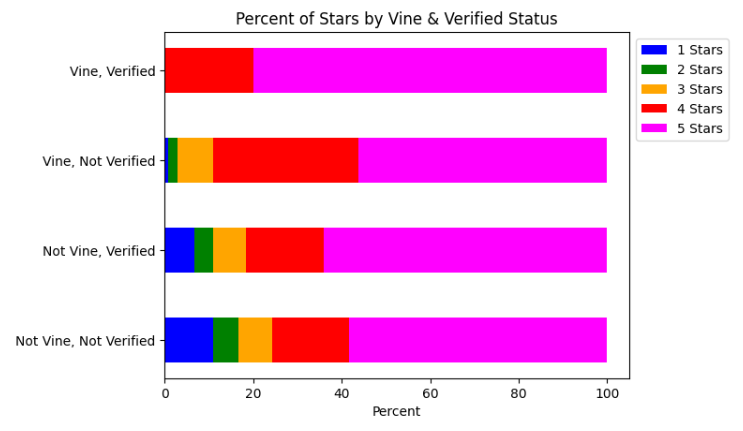
The image above gives us a good idea of the makeup of each category in terms of the stars they receive. Representing the information in this way can help us determine how Vine and Verified Status are related to ratings.
Distribution of Reviews by Vine/Verified Status
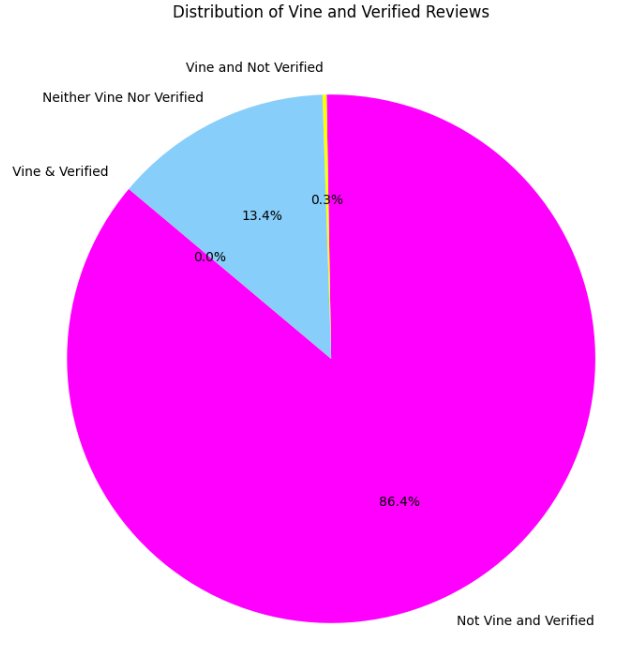
This pie chart shows the breakdown of reviews by each type. It’s worth noting how a majority of the reviews are Non-Vine and Verified.
Unhelpful & Helpful Reviews
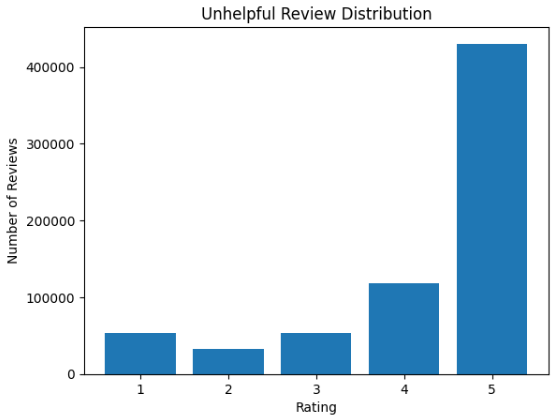
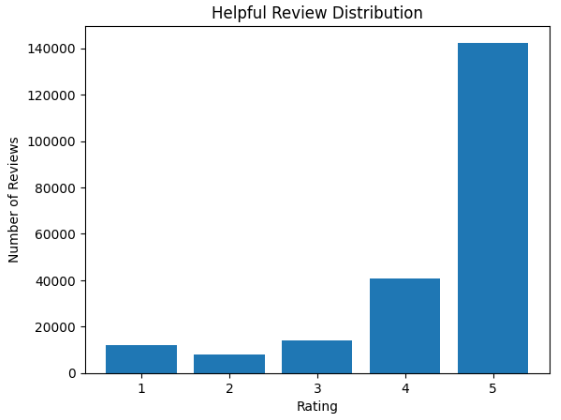
The two graphs above show the number of helpful and unhelpful reviews and their distribution of stars.
Distribution of Helpful vs. Unhelpful Reviews:
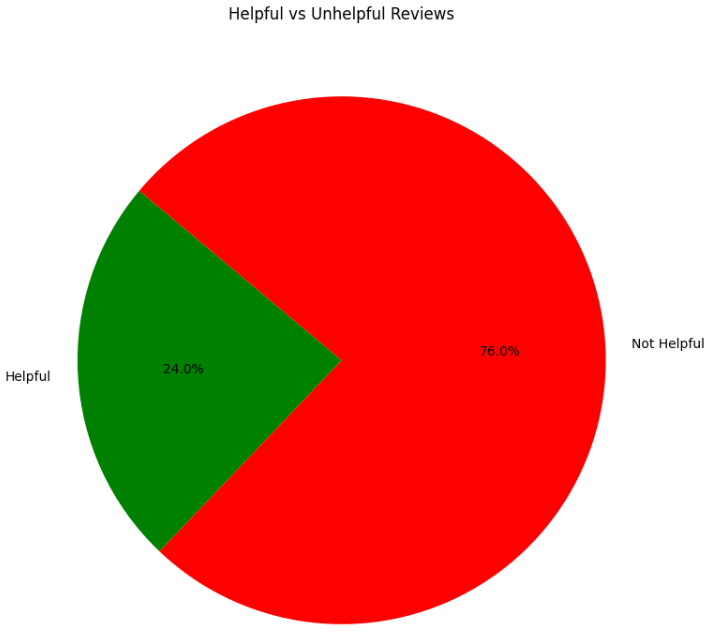
It seems that most of the reviews are not helpful, which could suggest that a lot of the reviews are either insignificant, spam, or that it is much more effort to rate a review as helpful than not helpful.
Filtered Data:
Although this is pretty similar, you can see a small difference in some of the points that are included. One can see that on average, most of the reviews hover around the range of 4.5 starts and generally decrease in variability as time moves forward, which is interesting and unexpected since the date shouldn’t affect how many stars a review should have.
Data Preprocessing for Supervised Learning
We are interested in detecting whether a review is spam and one of the primary ways of doing that is by looking at the review body. However there are some other useful fields as well including customer ID, product ID, product title, star rating, helpful votes, total votes, whether it was a Vine review, whether the review is on a verified purchase, the review headline, and the review date. All of these rows are unlabeled, which means that we will have to label reviews as spam or not ourselves before performing any supervised (or at least semi-supervised) learning.
There is significant research in spam detection from unlabeled data [6, 7, 8, 9, 10]. We will be focusing on using methods from [4] and from [5] because they use Amazon reviews as their dataset as well. Also as [10] suggested, manual human labeling is actually error-prone and ineffective at actually detecting spam or not. Thus we will be using a rule-based process for labeling spam reviews:
- We will find duplicate reviews (if either the review body or the review header is identical) in the dataset. There are at least 60,000 duplicate reviews in the dataset. We can guarantee with a high probability that these are spam reviews because it is very unlikely for one to write the same review for different products.
We will further whittle down this dataset by looking at whether or not the review is a verified purchase and if the ratio between the helpful votes and total votes is greater than 80%. This ensures we don’t only identify based on the review body, as [10] suggested that the same review on the same product does not necessarily mean that it is a spam review.
-
We will find the User IDs of these reviews and assume that all other reviews made by this user are also spam reviews.
-
We then convert the review bodies into unigrams/bigrams and then compare each unlabeled review’s unigrams/bigrams with the spam review’s unigrams/bigrams and if the cosine similarity is greater than 0.99 then we consider that review as spam as well.
- We featurize the unigrams/bigrams into count frequencies and TD-IDF vectors.
- Since there are A LOT of unigram/bigram features, we need to reduce the number of features. Moreover, the matrix is sparse so PCA cannot be applied. Therefore, we have to use sklearn’s Truncated SVD to reduce the millions of features down to 100 features. Since this method is randomized, we fix the seed and transform the data. We chose 150 features because there is still a lot of variance among the features and 150 features actually only explain around 68.2% of the variance for the Bag of Words features and 53.9% for the TF-IDF features.
- Also, to limit the initial amount of features used to 100000000 and ignore unigrams/bigrams with document frequency ratio greater than 0.99 and less than .01 because these features aren’t representative of the reviews since they occur too much or too little.
- We choose Truncated SVD since it is a very common method to feature-reduce in NLP, it is also called Latent Semantic Analysis (LSA): TruncatedSVD Sklearn Documentation
Before performing these steps, we need to clean the data by removing quotes, punctuation, digits, stop words, and having all text as lowercase. Moreover, we can remove the marketplace, product_parent, and product category since these are all the same for the dataset or intuitively provide no bearing to predicting whether a review is spam or not.
In the end, out of the 900,000 reviews, we label approximately 90,000 of them as spam and the rest as not spam. We still have to be mindful that this labeling might not be entirely correct but with a high probability of being correct.
Moreover, here are some metrics during feature reduction for both the BoW and TF-IDF features:
| Feature | Original Sparsity | Explained Variance after reducing to 150 features |
| Bag-Of-Words | 0.29 | 0.682 |
| TF-IDF | 0.29 | 0.539 |
Alternative Spam Identification method
From [13], Mukherjee et. al has provided experiments that have shown that behaviorial analysis of the customers is more effective at predicting spam than using bi-grams or any other natural language processing feature. So another way to identify spam is potentially not by looking at individual spam reviews, but by identifying spammers. To do so, we have to group every review by the customer who made it. We then attempt to filter customers as suspicious based on behavior rules from [13]. Then, the rule based algorithm is as follows:
1. If the customer has made less then or equal to 4 reviews, we analyze their reviews further. From [13], most spammers only reviewed during small activity windows and had low review counts.

2. If the customer only posted their reviews on the majority of one day, we consider that suspicious (at least 3/4 of the reviews one day).

3. If the customer only posted reviews that are of one rating, such as only 1 star reviews, we consider that suspicious (at least 3/4 of reviews are single rating).

4. If the customer posted reviews that are generally disagreed upon i.e. the sum of the total helpful votes on all their reviews / total votes is less than 60%, we consider that suspicious.

5. If the customer posted duplicate reviews, either having identical headers or the review bodies we consider that suspicious.

6. If the customer has at least one non verified purchase review, we consider that as suspicious.
If the customer meets all of these critiera, we consider them as spammers and then consider all of their reviews as spam.
Unsupervised Clustering on the Feature Reduced BoW Vectors and TF-IDF Vectors:
Besides clustering the data on ratings and helpfulness, using the BoW and the TF-IDF features we extracted, we attempt to K-means cluster assuming that K = 2 and hope that it can cluster spam and non-spam into two different clusters. Below are the results using several different clustering metrics:
| Review Clustering on BoW features Reduced to 150 features | |
| Metric | Value |
| Homogeneity | 0.001 |
| Completeness | 0.002 |
| V-measure | 0.001 |
| Adjusted Rand-Index | -0.021 |
| Silhouette Coefficient | 0.614 |
| Davies Bouldin Score | 2.368 |
| Review Clustering on TFIDF features Reduced to 150 features | |
| Metric | Value |
| Homogeneity | 0.001 |
| Completeness | 0.002 |
| V-measure | 0.001 |
| Adjusted Rand-Index | -0.021 |
| Silhouette Coefficient | 0.591 |
| Davies Bouldin Score | 2.369 |
Unfortunately, based on the V-measure, which combines homogeneity and completeness, is extremely low in both clustering methods, which means that inherently spam is not easily distinguishable as a latent cluster among these features. Moreover, the Adjusted Rand-Index is less than 0, which means that the clustering is somehow worse than clustering by random chance, which means the two clusterings have less in common than random choice. However, the silhouette coefficient for both clusterings is noticeably greater than 0, which suggests that the reviews are far apart and can be distinguished, perhaps by a different type of labeling. Since the Davies-Bouldin Score is a value relative to the dataset, we do not have much confidence in whether or not the scores on the clustering are relatively low compared to other methods. Though, they are relatively close for both features and perhaps could signal good separation of clusters. In other words, the external clustering measures performed poorly, but this might be because of poor labeling whereas the internal cluster measure of the Silhouette coefficient clustering measure presents more promising results.
TSNE Diagrams
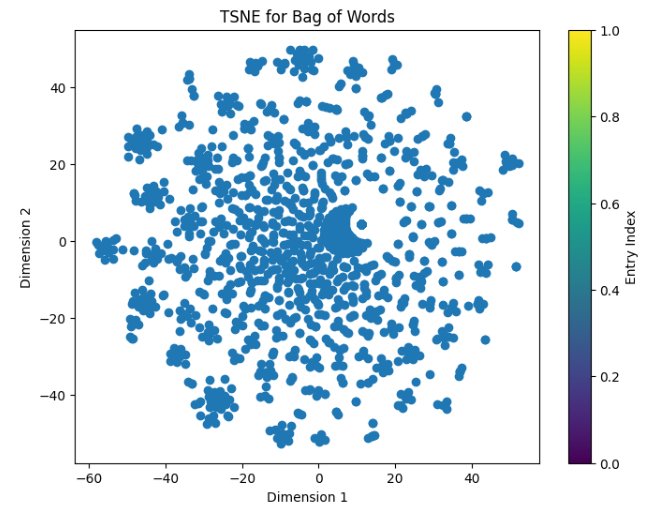
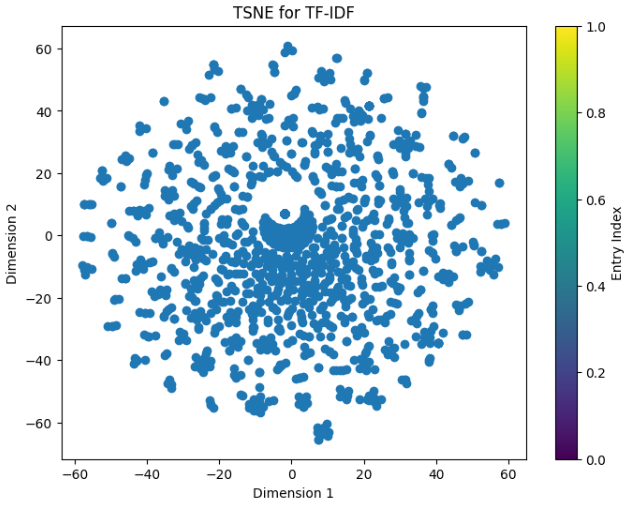
These are two TSNE Diagrams consisting of random samples of 1500 for meaningful entries (helpfulness of 1). There is a TSNE plot for both Bag of Words as well as TF-IDF.
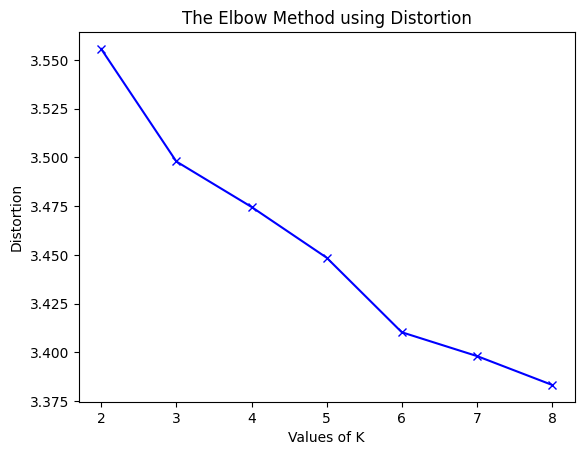
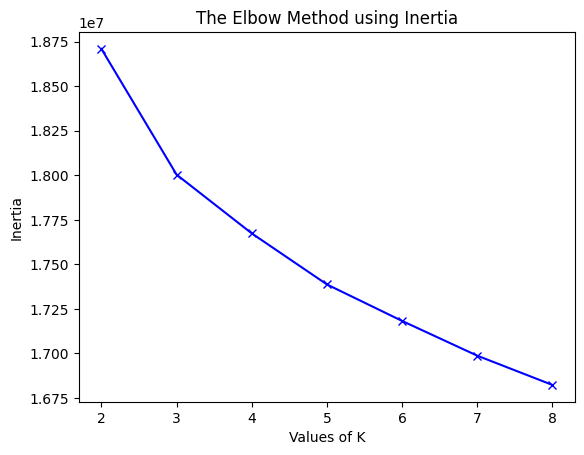
Finding a better K using the elbow method:
Perhaps distinguishing the reviews by spam or not spam is not the best way to cluster them. Therefore, we attempt the elbow method where K ranges from 2 to 8 and calculate the distortion, which is the average of the squared distances from the cluster centers of the respective clusters to each data point, and the inertia, which is the sum of the squared distances of samples to their closest cluster center. When we see these values decrease and reach almost a straight line, we can choose that value of $k$ to use and perhaps it will perform much better.
Elbow Method for BoW features:
Elbow Method for TF-IDF features:
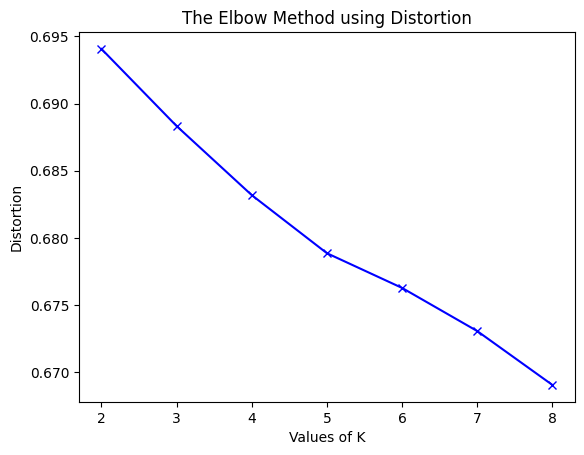
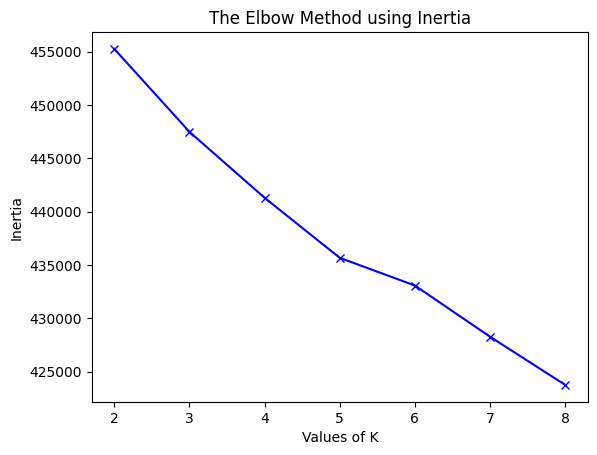
It seems in both cases the elbow method starts decreasing rapidly until K = 8 (especially for the BoW features) and it might decrease even more, but for the sake of computational feasibility, we will only consider K = 8. So now let’s evaluate it when K = 8:
| BoW 150 features K = 8 | |
| Metric | Value |
| Homogeneity | 0.006 |
| Completeness | 0.002 |
| V-measure | 0.003 |
| Adjusted Rand-Index | -0.022 |
| Silhouette Coefficient | 0.093 |
| Davies Bouldin Score | 3.701 |
| TFIDF 150 features K = 8 | |
| Metric | Value |
| Homogeneity | 0.007 |
| Completeness | 0.001 |
| V-measure | 0.002 |
| Adjusted Rand-Index | 0.004 |
| Silhouette Coefficient | 0.023 |
| Davies Bouldin Score | 4.591 |
It seems that the internal clustering measures such as the Silhouette Coefficient and the Davies Bouldin Score both get worse with a higher K, which suggests that perhaps having a lower K is preferable. Something to note is now we have another Davies Bouldin Score to compare to, which means that a value below 3 is relatively good. Moreover the V-measure slightly increases with the higher K, which further adds evidence that the labeling method might not be precise.
Unsupervised learning on the alternative features
Based on the alternative features we mentioned in the data-preprocessing step using the features of star rating, helpful_votes, total_votes, verified_purchas, number of words in review body, number of words in review head, taking a subset of 15637 spam reviews and 3 * 16537 = 62548 non-spam reviews a TSNE visualization of the data is:
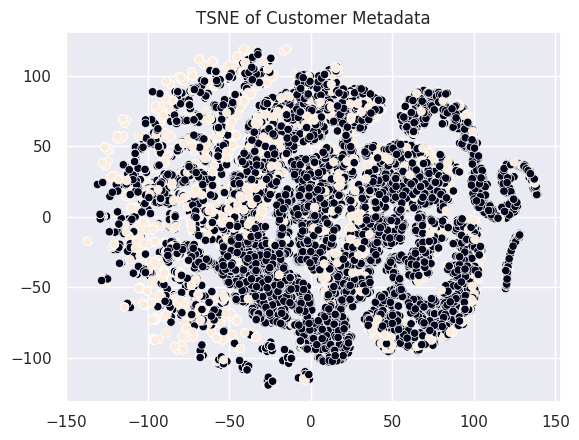
Here the white dots represent the spam reviews and the black dots represent not spam reviews.
Supervised Learning Using CNN and Preprocessed Data
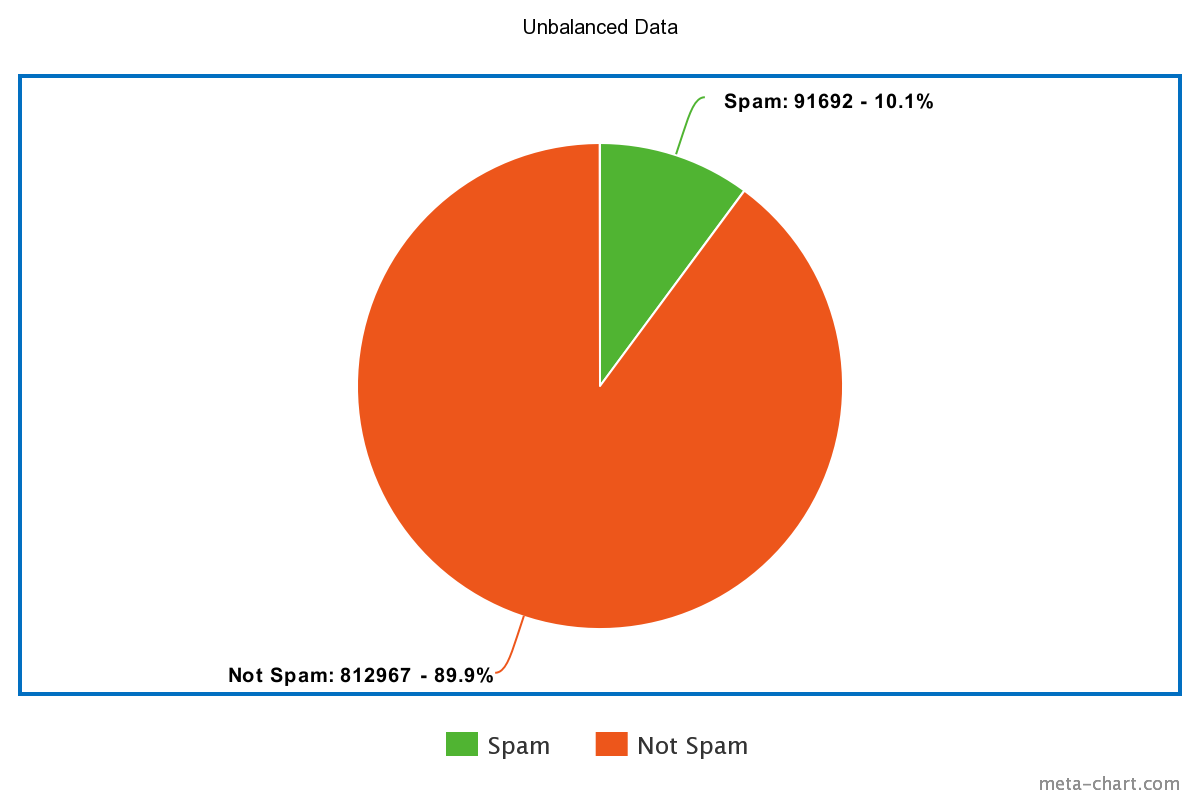
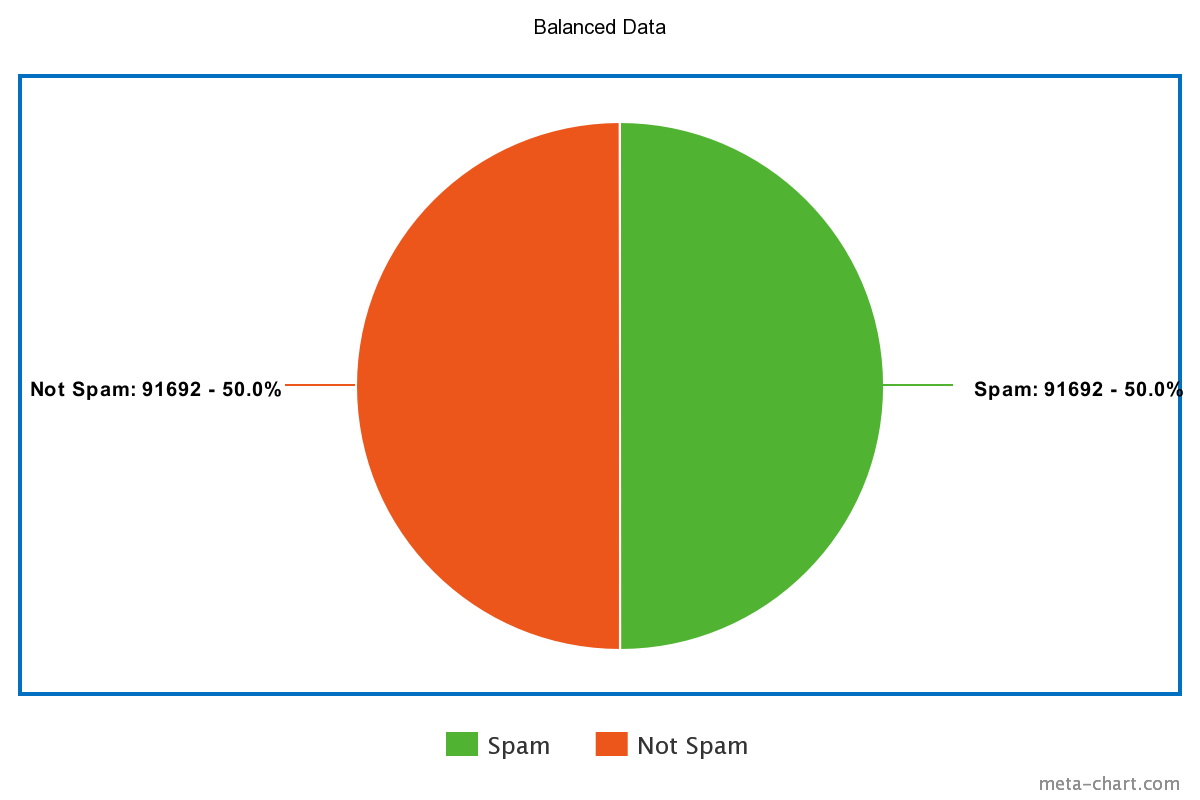
With the labels generated, we created a Convolutional Neural Network to classify whether a review was spam or not. We drew inspiration from the Neural Network found in [12]. The author Jeff Prosise uses Natural Language Processing to process and tokenize the content of an email. He takes these features and runs them through a NN to detect whether or not the email should be classified as spam. We used a similar approach as in [12] to tokenize the content of the review body. We started by balancing the amount of spam and not spam from our dataset. Then, we deleted all the stop words from the review. The dataset was then divided into training and testing splits. The review body was tokenized into Nx500 arrays.
Unbalanced vs Balanced Labeled Data:
The tokenized balanced data was then passed into the CNN for training. Our Convolutional Neural Network model has the following layers:
| Layer (type) | Output Shape | Param # |
|---|---|---|
| embedding_1 (Embedding) | (None, 500, 32) | 640000 |
| conv1d_2 (Conv1D) | (None, 494, 32) | 7200 |
| max_pooling1d_1 (MaxPooling1D) | (None, 98, 32) | 0 |
| conv1d_3 (Conv1D) | (None, 92, 32) | 7200 |
| global_max_pooling1d_1 (GlobalMaxPooling1D) | (None, 32) | 0 |
| dense_1 (Dense) | (None, 1) | 33 |
| Total params: 654433 (2.50 MB) | ||
| Trainable params: 654433 (2.50 MB) | ||
| Non-trainable params: 0 (0.00 Byte) |
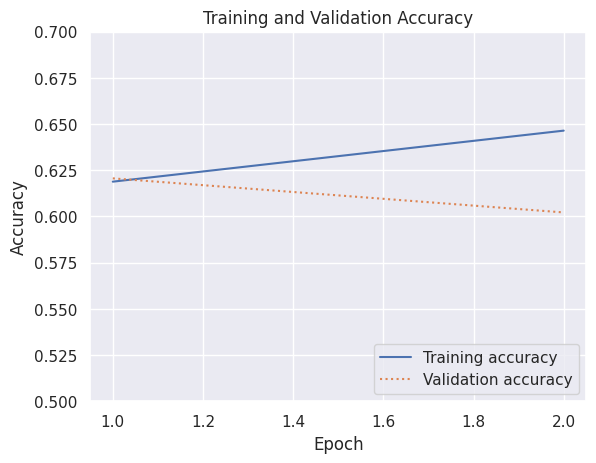
Training vs Validation:
Confusion Matrix:
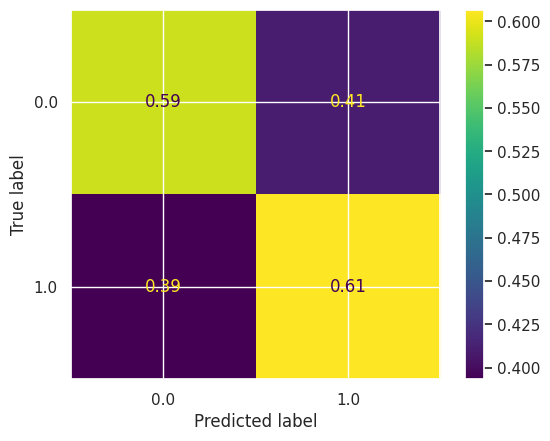
The model achieved 0.60 accuracy. From the confusion matrix, we can see that the model is predicting correctly ~60% of the time.
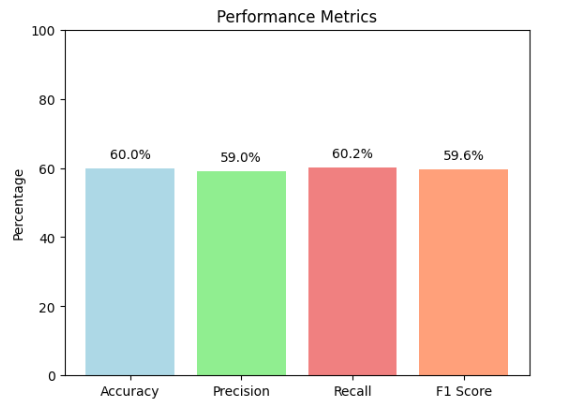
This figure shows the accuracy, precision, recall as well as F1Score for this particular model.
Using K-means to generate labels
We also tried using other methods to preprocess the data and generate labels. One such method was to use k-means clustering to generate labels for our data set. This resulted in around 24708 data points labeled as spam. We used the same method above to balance the data, tokenize it, and use this balanced data set to train the CNN.
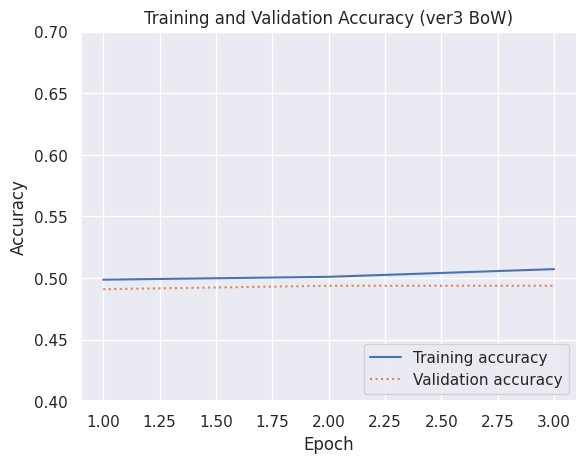
Training vs Validation:
Confusion Matrix:
It resulted in 50% validation accuracy, much lower than our first approach.
This figure shows the accuracy, precision, recall as well as F1 Score for this particular model. We can see that the performance of this model is worse than the previous version in all categories.
Using alternative features for model training
Based on the TSNE visualization it seems that there is a visual distinction one can make about the classes in the dataset. Using a modified model and 10 epochs:
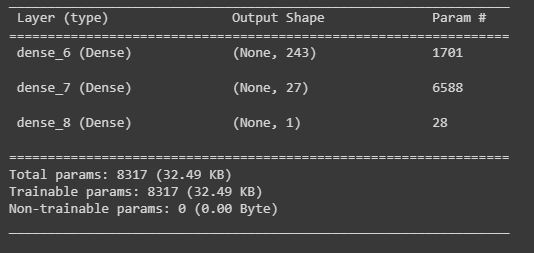
Here each layer is connected by a sigmoid activation, and the loss is still binary cross-entropy.
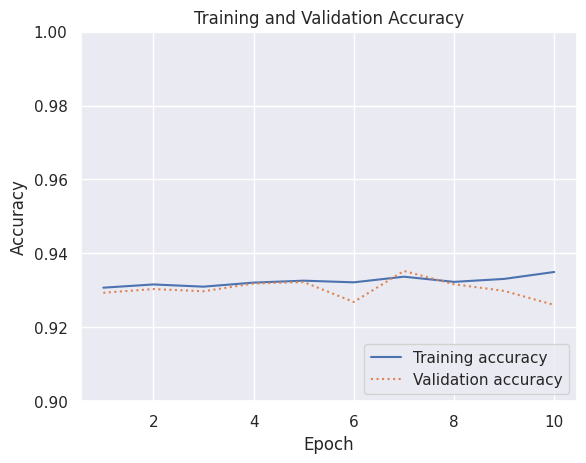
Training vs Validation:
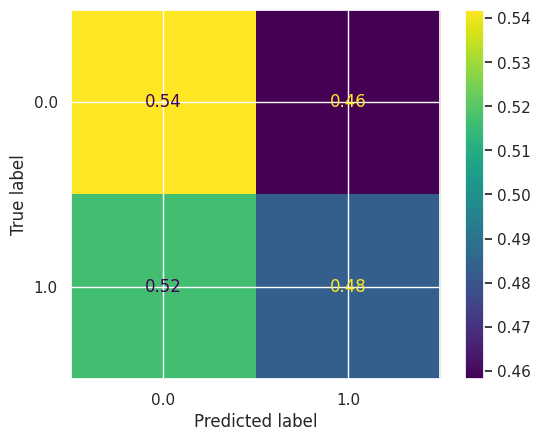
Confusion Matrix:
Clearly, based on this confusion matrix the accuracy of the data significantly improved and this is on an imbalanced dataset as well.
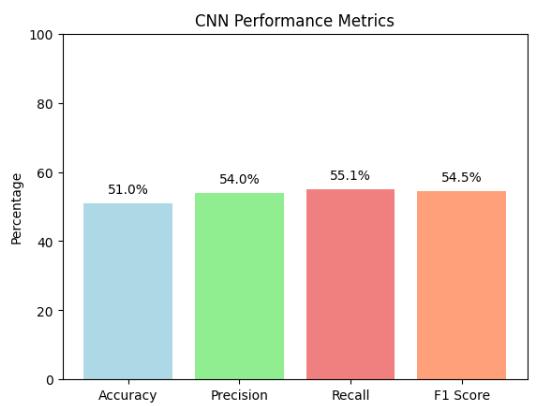
This figure shows the accuracy, precision, recall as well as F1Score for this particular model.
Results Analysis and Conclusion
Unsupervised
- Our external clustering metrics of Homogeneity and Adjusted Rand-Index, showed poor performance with an extremely low V-measure. These metrics indicated challenges in distinguishing spam as a distinct cluster based on the given features.
- Despite external metric limitations, the Silhouette Coefficient demonstrated potential for distinguishing reviews, suggesting that reviews were relatively far apart and could be differentiated with a score being noticeably greater than zero. This internal measure hinted at the possibility of effective separation with alternative labeling approaches.
- The Elbow Method suggested K = 8 as a potential choice, but subsequent evaluations showed mixed results. Our Internal clustering measures of the Silhouette Coefficient and Davies Bouldin Score indicated deterioration with a higher K, emphasizing the need for careful consideration in choosing the number of clusters. The metrics tended to worsen as K increased, suggesting a preference for a lower K. This analysis underscored the importance of exploring different K values to optimize clustering performance in our model.
- The increase in V-measure with a higher K coupled with the hypothesis emphasized the importance of revisiting our labeling methodology in data pre-processing. Distinguishing spam into distinct classes based on variations in characteristics could have enhanced clustering effectiveness.
Supervised
- The dataset balancing analysis highlights the impact of balancing the dataset by addressing the imbalance between spam and non-spam reviews. The balancing procedure focuses on equalizing the representation of spam and non-spam instances, contributing to a more robust model.
- Achieving an accuracy of 0.60, the CNN model demonstrates effectiveness in review classification. The accompanying confusion matrix unveils a 60% correct prediction rate, offering a comprehensive metric to evaluate the model’s proficiency in distinguishing between spam and non-spam reviews.
- An alternative approach to labeling involves using k-means clustering to generate labels for the dataset. The data is then balanced, tokenized, and used to train the CNN model. A comparative analysis scrutinizes the performance disparity between the CNN model trained on originally labeled data and the model trained on labels derived from k-means clustering. Notably, the validation accuracy for the k-means approach reaches 50%, signaling a diminished accuracy in contrast to the initial labeling strategy.
- The results prompt consideration of different labeling strategies. The choice of how labels are assigned significantly impacts the model’s performance. The analysis suggests that the initial labeling method may be more effective than the k-means clustering approach in this context.
Supervised #2
- We trained another model based on different features of the reviews and got a significantly higher classification accuracy than the other previous models at near 90% classification accuracy.
- Not only that, but there is significant class imbalance in the dataset, with three times more non spam than spam, which is more realistic because there are usually more non-spam reviews than spam reviews.
- The rules used to detect spam justify and further support the conclusions made in [13].
Future Work
In terms of future work, one possible way to improve our results is by adding Part-Of-Speech Bigrams, Deep Syntax, and Part-Of-Speech Sequence Patterns as well because [13] included these features in their Yelp spam detection and it improved classification accuracy. However, despite these features, [13] notes that due to the class distribution imbalance, it is very difficult to filter fake review and even they achieve a low precision using these features. [13] also mentions that the reason why Yelp performs so well at filtering spam reviews is because they also use internal user metrics such as IP address, user session logs, account history, and user interactions, which are not publically available. Therefore, our work further validates the hypothesis that NLP analysis of reviews might not be the most effective at detecting spam reviews. Instead, it seems that in general, using heuristics about the behavior of spammer such as activity window, total number of reviews, and review length could be more effective [13]. Perhaps by somehow acquiring more customer metadata, one can further improve the accuracy of the model in detecting true positives, since, based on the confusion matrix, that is where the model is most inaccurate.
Timeline & Contribution Table (Gantt Chart)
 Link to Gantt Chart: http://tiny.cc/fn5evz
| Contribution Table | |
| Matthew Chen | Project proposal Potential Results and discussion |
| Project: Data cleaning, Labeling, Feature reduction, Unsupervised learning | |
| Lucas Luwa | Proposal: GitHub repo and GitHub Page creation. Checkpoints |
| Project: Data visualization, metrics visualization | |
| Carolina Hau Loo | Proposal: Methods, Gantt Chart and Contribution table |
| Project: Feature reduction, report writing, Supervised learning, final video recording | |
| James Wellington | Proposal: Problem definition |
| Project: Data cleaning, Feature Reduction, Report Writing, Results Analysis/Conclusion | |
| Desiree Dominguez | Proposal: Introduction and background. Peer reviewed sources. Video recording |
| Project: Unsupervised learning with mock data |
References
-
Haque, Tanjim Ul, Nudrat Nawal Saber, and Faisal Muhammad Shah. “Sentiment analysis on large scale Amazon product reviews.” 2018 IEEE international conference on innovative research and development (ICIRD). IEEE, 2018.
-
Chen, Mingxiang, and Yi Sun. “Sentimental Analysis with Amazon Review Data.” (2017).
-
Mukherjee, Anirban, et al. “Utilization of oversampling for multiclass sentiment analysis on amazon review dataset.” 2019 IEEE 10th international conference on awareness science and technology (iCAST). IEEE, 2019.
-
Amazon_us_reviews : tensorflow datasets. TensorFlow. (n.d.). https://www.tensorflow.org/datasets/catalog/amazon_us_reviews#amazon_us_reviewsmusical_instruments_v1_00
-
“FileNotFound: Does this still work?” https://huggingface.co/datasets/amazon_us_reviews/discussions/4
-
Myle Ott, Yejin Choi, Claire Cardie, and Jeffrey T. Hancock. 2011. Finding Deceptive Opinion Spam by Any Stretch of the Imagination. In Proceedings of the 49th Annual Meeting of the Association for Computational Linguistics: Human Language Technologies, pages 309–319, Portland, Oregon, USA. Association for Computational Linguistics.
-
Mukherjee, Arjun et al. “What Yelp Fake Review Filter Might Be Doing?” Proceedings of the International AAAI Conference on Web and Social Media (2013): n. pag.
-
H. Li, Z. Chen, B. Liu, X. Wei and J. Shao, “Spotting Fake Reviews via Collective Positive-Unlabeled Learning,” 2014 IEEE International Conference on Data Mining, Shenzhen, China, 2014, pp. 899-904, doi: 10.1109/ICDM.2014.47.
-
Wijnhoven, Fons and Pieper, Anna Theres, “Review spam criteria for enhancing a review spam detector” (2018). ICIS 2018 Proceedings. 3. https://aisel.aisnet.org/icis2018/social/Presentations/3
-
Jindal, Nitin and B. Liu. “Opinion spam and analysis.” Web Search and Data Mining (2008).
-
Arvind Mewada, Rupesh Kumar Dewang, Research on false review detection Methods: A state-of-the-art review, Journal of King Saud University - Computer and Information Sciences, Volume 34, Issue 9, 2022, Pages 7530-7546, ISSN 1319-1578, https://doi.org/10.1016/j.jksuci.2021.07.021.
-
Prosise, Jeff, Identifying spam e-mails with neural networks, GitHub, https://github.com/jeffprosise/Deep-Learning/blob/master/E-Mail%20Classification.ipynb
-
Mukherjee, Arjun et al. “Fake Review Detection : Classification and Analysis of Real and Pseudo Reviews.” (2013).